

When Cheméo predicts a property, it gives you a number. A boiling point, a critical temperature, an enthalpy of formation. The number is the easy part. The question every chemist asks next is harder: can I trust it for this molecule?
Now, in the bottom left corner of the prediction page, there is a plot that answers exactly that.
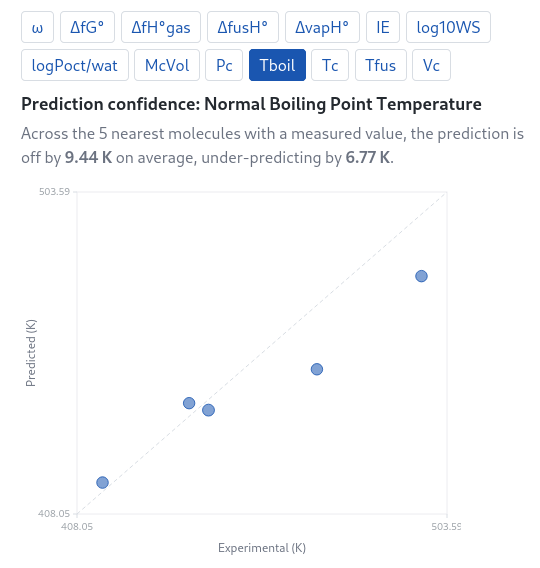
It is a parity plot: predicted value on one axis, experimental value on the other, and a dashed diagonal where the two agree. But it is not the model's global scorecard. It is built only from the measured molecules nearest to the one you just drew.
Cheméo already knows how to find similar molecules. So when you predict, it takes the molecule in front of you, finds the neighbours in the database that carry both an experimental measurement and a Cheméo Relay prediction, and plots one against the other. The molecule in this example is 2-octanone, 7-methyl-, and the property is the normal boiling point. Across the five nearest molecules with a measured value, the prediction is off by 9.44 K on average, and it under-predicts by 6.77 K.
That second number is the useful one. The average error tells you the model is roughly right around here. The bias tells you which way it leans: on molecules like this one it reads a little low, so the true boiling point is probably a few kelvin above the 461 K it printed. You pick the property with the chips above the plot, and the plot and the two numbers follow.
This is the right question to ask. A model has a global R², and it tells you how it does on average, across everything it was trained on. But you are not predicting the average molecule. You are predicting the one on your screen. A model can be excellent overall and quietly bad on one family of compounds, and the global number hides that while the neighbours show it.
Thousands of neighbours, under a second
None of this is precomputed.
As you build the molecule, atom by atom, Cheméo searches thousands of similar molecules, keeps the nearest ones that carry a measured value, pulls their experimental and predicted numbers, and draws the plot. It does this in less than a second, so the plot is simply there, updating as you draw, the same way the prediction is.
That is the part I am proud of, and it is the part that does not show. The plot looks trivial, five dots and a diagonal. Underneath it: a fingerprint of the molecule you are drawing, a similarity search across the whole database, thousands of neighbours ranked, the measured ones kept, each one's experimental value matched against its Relay prediction, all of it in the time it takes you to let go of the mouse.
So the prediction is no longer a number sitting on its own. It arrives with the nearest molecules that vouch for it, and it tells you by how much.
None of this is new. Ten years ago the same check lived in Cheméo Studio, the desktop software: the prediction checked against similar molecules, parity plots drawn in real time, for anyone who installed the program. Today it needs no install and no licence. You draw the molecule on chemeo.com with a free account, and the plot is there.